Render elevation data
MapTiler provides a global tileset with elevation data encoded as PNG files.
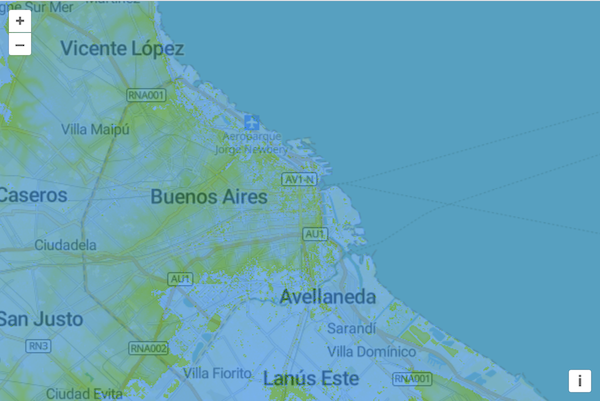
Let's see what these tiles look like by adding them to our map. In your main.js, create a new layer that uses the MapTiler terrain-rgb tileset:
const layer = new TileLayer({
  opacity: 0.6,
  source: new XYZ({
    url:
      'https://api.maptiler.com/tiles/terrain-rgb/{z}/{x}/{y}.png?key=' + key,
    maxZoom: 10,
    tileSize: 512,
    crossOrigin: 'anonymous',
  }),
});
After adding that layer to your map, you should be able to reload the page some oddly colored tiles shown over your base layer. The elevation data in the Terrain-RGB tiles is encoded in the red, green, and blue channels. So while this data isn't meant to be rendered directly, it is interesting to look at.