Visualization chooser
In the previous examples, we have seen a true color composite, a false color composite, and an NDVI rendering of the same Sentinel-2 image. It would be nice to allow users to choose from one of these visualizations and more without having to change our code each time. To do this, we'll create a list of available visualizations and add a <select> element to our page to let users choose which to display.
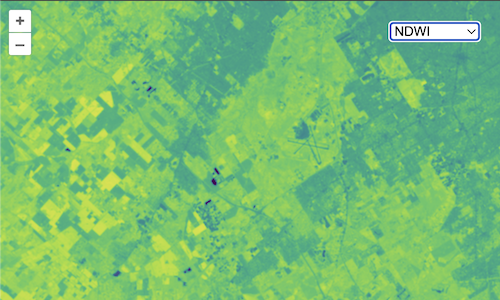
In addition to the true color, false color, and NDVI visualizations, we'll add a new Normalized Difference Water Index (NDWI). This is similar to NDVI except that it can be used to monitor changes in water bodies.
NDWI = (GREEN - NIR) / (GREEN + NIR)
As we've seen, each visualization needs to have an array of sources (these are the URLs for single- or multi-band GeoTIFFs), an optional max value for scaling GeoTIFF values, and an optional style for rendering the layer. In addition, we'll give each visualization a name for displaying to the user.
Edit your main.js to include the visualizations data below:
const visualizations = [
  {
    name: 'True Color',
    sources: ['TCI'],
  },
  {
    name: 'False Color',
    sources: ['B08', 'B04', 'B03'],
    max: 5000,
  },
  {
    name: 'NDVI',
    sources: ['B04', 'B08'],
    max: 10000,
    style: {
      color: [
        'interpolate',
        ['linear'],
        ['/', ['-', ['band', 2], ['band', 1]], ['+', ['band', 2], ['band', 1]]],
        ...getColorStops('earth', -0.5, 1, 10, true),
      ],
    },
  },
  {
    name: 'NDWI',
    sources: ['B03', 'B08'],
    max: 10000,
    style: {
      color: [
        'interpolate',
        ['linear'],
        ['/', ['-', ['band', 1], ['band', 2]], ['+', ['band', 1], ['band', 2]]],
        ...getColorStops('viridis', -1, 1, 10, true),
      ],
    },
  },
];
Now instead of creating our GeoTIFF source and layer once, we need a function to create these when the user chooses a visualization. This function will take a base URL and a visualization and will return a layer. Edit your main.js to remove the source and layer definitions and include this function instead:
function createLayer(base, visualization) {
  const source = new GeoTIFF({
    sources: visualization.sources.map((id) => ({
      url: `${base}/${id}.tif`,
      max: visualization.max,
    })),
  });

  return new TileLayer({
    source: source,
    style: visualization.style,
  });
}
Next we can change the map definition in main.js so it doesn't include any layers at all (these will be added when the user selects a visualization):
const map = new Map({
  target: 'map-container',
});
Now we need a way for users to choose which visualization to show. For this, we'll add a <select> element to the index.html just before the <script> tag:
<div id="controls">
  <select id="visualization"></select>
</div>
To get this <select> element to display over the map in the top right corner, add the following block to the <style> tag in your index.html:
#controls {
  position: absolute;
  top: 20px;
  right: 20px;
}
With the <select> element in place, we need to populate it with an <option> for each of the visualization names. To do this, add the following to your main.js somwhere below the visualizations array:
const visualizationSelector = document.getElementById('visualization');
visualizations.forEach((visualization) => {
  const option = document.createElement('option');
  option.textContent = visualization.name;
  visualizationSelector.appendChild(option);
});
Finally, we will create a function to update the map with a new layer based on the selected visualization. We'll add this function as a change listener on our <select> element and call it to initalize our application:
function updateVisualization() {
  const visualization = visualizations[visualizationSelector.selectedIndex];
  const base =
    'https://sentinel-cogs.s3.us-west-2.amazonaws.com/sentinel-s2-l2a-cogs/21/H/UB/2021/9/S2B_21HUB_20210915_0_L2A';

  const layer = createLayer(base, visualization);
  map.setLayers([layer]);

  map.setView(layer.getSource().getView());
}

visualizationSelector.addEventListener('change', updateVisualization);
updateVisualization();
Now http://localhost:5173/ should show a visualization chooser.
Nice! Now the user can choose what type of visualization to render. But wouldn't it be nice to be able to change the imagery source too? That's next.