Rendering meteorites with Canvas 2D
Starting with OpenLayers 6, each layer in a map has an independent renderer. Previously, all layer rendering was managed by a single map renderer and depended on a single rendering strategy. So prior to OpenLayers 6, you needed to choose between Canvas 2D or WebGL rendering for all layers. In recent OpenLayers versions, you can have a map composed of layers with different rendering strategies. For example, you can render some layers with a Canvas 2D renderer and others with a WebGL renderer.
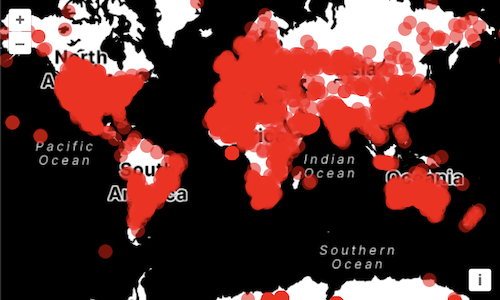
The ol/layer/Vector class uses Canvas 2D to render points, lines, or polygons. This layer has a full featured renderer with a ton of flexibility in feature styling. For very large numbers of features, WebGL might be a more appropriate technology. In this module, we'll start by using Canvas 2D to render 45,000 meteorite locations and then migrate the example to WebGL.
First, edit your index.html so we're ready to render a full page map:
<!DOCTYPE html>
<html>
  <head>
    <meta charset="utf-8">
    <title>OpenLayers</title>
    <style>
      @import "node_modules/ol/ol.css";
    </style>
    <style>
      html, body, #map-container {
        margin: 0;
        height: 100%;
        width: 100%;
        font-family: sans-serif;
      }
    </style>
  </head>
  <body>
    <div id="map-container"></div>
    <script src="./main.js" type="module"></script>
  </body>
</html>
Next we'll fetch and parse data from a local CSV file, add the resulting features to a vector source, and render it on the map with a vector layer.
The meteorites.csv file has data in it that looks like this:
name,mass,year,reclat,reclong
Aachen,21,1880,50.775000,6.083330
...
We're going to use the convenient papaparse library to parse the csv. It has already been added as dependency to the workshop, so we can import its parse function without the need to run npm install. We only need to write a short complete handler function that creates OpenLayers Features from the rows in the csv, with mass and year being numbers, not strings, and Point geometries representing the latitude ( reclat) and longitude (reclong) of the meteorite impact.
Update your main.js to load and render a local CSV file with data representing meteorite impacts:
import Feature from 'ol/Feature';
import Point from 'ol/geom/Point';
import TileLayer from 'ol/layer/Tile';
import VectorLayer from 'ol/layer/Vector';
import {Map, View} from 'ol';
import {StadiaMaps, Vector as VectorSource} from 'ol/source';
import {fromLonLat} from 'ol/proj';
import {parse} from 'papaparse';

const source = new VectorSource();
parse('./data/meteorites.csv', {
  download: true,
  header: true,
  complete(result) {
    source.addFeatures(
      result.data.map(
        (row) =>
          new Feature({
            mass: parseFloat(row.mass) || 0,
            year: parseInt(row.year) || 0,
            geometry: new Point(
              fromLonLat([parseFloat(row.reclong), parseFloat(row.reclat)]),
            ),
          }),
      ),
    );
  },
});

const meteorites = new VectorLayer({
  source: source,
  style: {
    'circle-radius': 7,
    'circle-fill-color': 'rgba(255, 0, 0, 0.5)',
  },
});

new Map({
  target: 'map-container',
  layers: [
    new TileLayer({
      source: new StadiaMaps({
        layer: 'stamen_toner',
      }),
    }),
    meteorites,
  ],
  view: new View({
    center: [0, 0],
    zoom: 2,
  }),
});
After fetching and parsing the data, features are added to a vector source. This source is rendered in a vector layer over a tile layer. We're applying very simple styling here - red, semi-transparent circles. The point is just to see how it feels to use the map with 45,000 features rendered with Canvas 2D.