Render sea level
In the previous step, we rendered the Terrain-RGB tiles directly on the map. What we want to do is render sea level on the map instead. And we want users to be able to adjust the height above sea level and see the adjusted height rendered on the map. We'll use a WebGL tile layer to work with the elevation data directly and get the user input from an input slider on the page.
Let's add the controls to the page first. In your index.html, add the following label and input slider:
<label id="slider">
  Sea level
  <input id="level" type="range" min="0" max="100" value="1"/>
  +<span id="output"></span> m
</label>
Now add some style to those controls (in the <style> of your index.html):
#slider {
  position: absolute;
  bottom: 1rem;
  width: 100%;
  text-align: center;
  text-shadow: 0px 0px 4px rgba(255, 255, 255, 1);
}
Instead of directly rendering the R, G, B, A values from the Terrain-RGB tiles, we want to manipulate the pixel values before rendering. The WebGL tile layer allows you to manipulate pixel values in a style expression before rendering them. This expression is evaluated for every pixel in the input source.
First, import the WebGLTile layer (in main.js):
import TileLayer from 'ol/layer/WebGLTile.js';
The elevation values in the terrain-rgb tiles are encoded as red, gree, and blue values (from 0-255) in the tiles according to the following formula:
elevation = -10000 + ((R * 256 * 256 + G * 256 + B) * 0.1)
We can use the WebGL style expression language to represent that formula. Add the expression below to your main.js. This expression decodes the input elevation data — transforming red, green, and blue values into a single elevation measure.
// band math operates on normalized values from 0-1
// so we scale by 255 to align with the elevation formula
// from https://cloud.maptiler.com/tiles/terrain-rgb/
const elevation = [
  '+',
  -10000,
  [
    '*',
    0.1 * 255,
    [
      '+',
      ['*', 256 * 256, ['band', 1]],
      ['+', ['*', 256, ['band', 2]], ['band', 3]],
    ],
  ],
];
Create a WebGL tile layer that uses the expression above:
const layer = new TileLayer({
  opacity: 0.6,
  source: new XYZ({
    url:
      'https://api.maptiler.com/tiles/terrain-rgb/{z}/{x}/{y}.png?key=' + key,
    maxZoom: 10,
    tileSize: 512,
    crossOrigin: 'anonymous',
  }),
  style: {
    variables: {
      level: 0,
    },
    color: [
      'case',
      ['<=', elevation, ['var', 'level']],
      [139, 212, 255, 1],
      [139, 212, 255, 0],
    ],
  },
});
The color expression above uses a case expression to color values at or below sea level as blue. Elevation values above sea level will be transparent (with an alpha value of 0).
Next we need to listen for changes on the slider input and update the seaLevel style variable when the user adjusts the value.
const control = document.getElementById('level');
const output = document.getElementById('output');
const listener = function () {
  output.innerText = control.value;
  layer.updateStyleVariables({level: parseFloat(control.value)});
};
control.addEventListener('input', listener);
control.addEventListener('change', listener);
output.innerText = control.value;
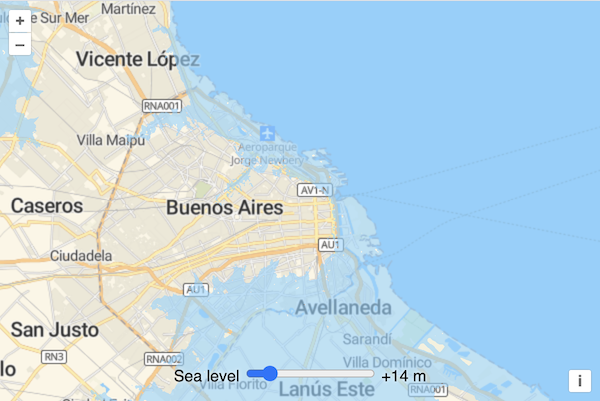
With all this in place, the map should now have a slider that let's users control changes in sea level.