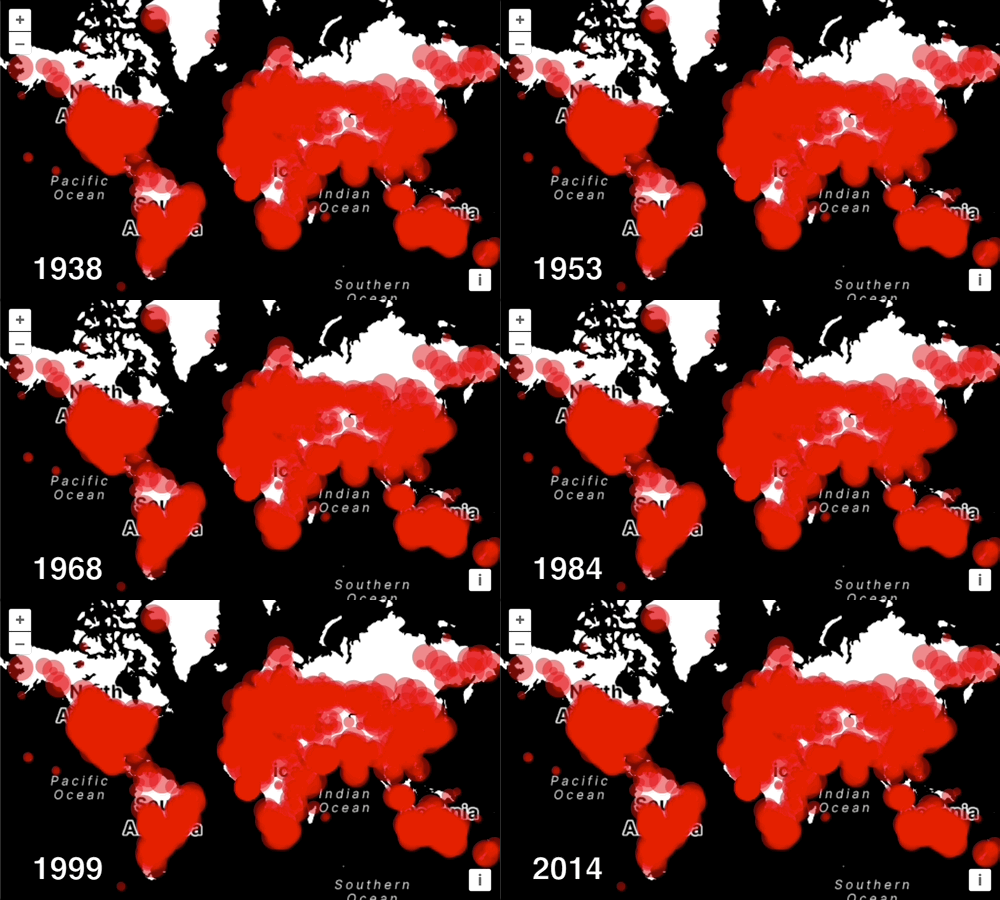
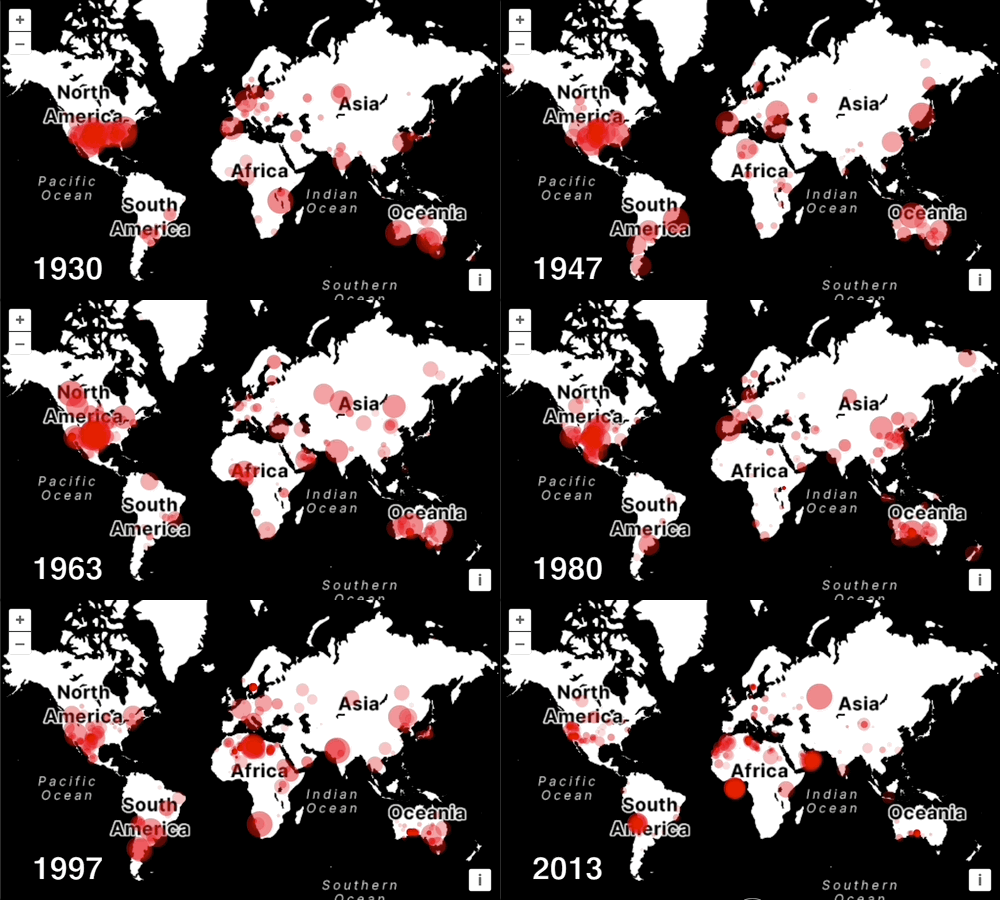
Animating meteorite impacts
So far we have managed to get data from our CSV file rendered with WebGL, but the map is pretty uninteresting. We're using the mass of the meteorite to determine the radius of the circle, but we're not making use of the meteorite impact date that we parsed as the year property in our point features.
The year property for our meteorite features have values that range from 1850 to 2015. We'll set up an animation loop that increments the current year, render meteorites on their impact year, and then decrease their size and opacity as time passes.
As a first step, we'll get the animation loop going and render the current year to a <div> on top of the map. Add the following markup below the map container in your index.html:
<div id="year"></div>
Edit the <style> block to include the following rule:
#year {
  position: absolute;
  bottom: 1em;
  left: 1em;
  color: white;
  -webkit-text-stroke: 1px black;
  font-size: 2em;
  font-weight: bold;
}
Now, back in main.js, we'll declare some variables to represent the time range of the data and the rate at which we want the animation to proceed. Add the following code above your const meteorites declaration in main.js:
const minYear = 1850;
const maxYear = 2015;
const span = maxYear - minYear;
const rate = 10; // years per second

const start = Date.now();
To be able to access the current year in style expressions, we need to use the variables constructor option on the meteorites layer and include the currentYear (whose value will start with minYear):
variables: {
  currentYear: minYear,
},
// ...other options like `style`
Style variables are values that are available in var expressions in the layer style.
Next we need to assign our map instance to a map variable that we can reference later:
const map = new Map({
Below the map configuration, add the following render function to get the animation loop started. In this function, we'll update the current year and call updateStyleVariables() on the meteorites layer to update the year used in the style expressions.
const yearElement = document.getElementById('year');

function render() {
  const elapsed = (rate * (Date.now() - start)) / 1000;
  const currentYear = Math.round(minYear + (elapsed % span));
  meteorites.updateStyleVariables({currentYear: currentYear});
  yearElement.innerText = currentYear;
  requestAnimationFrame(render);
}

render();
If you got it all right, you should see the years rolling by in the lower left corner above the map.

We also add another layer option to the meteorites layer, which will improve the performance of the animation – we do not need to process hit detection data in every anmiation step.
disableHitDetection: true,
Now to show the temporal context on the map, we only want to show each meteorite for a period of 10 years, starting at the time of its impact. For this, we're adding a filter to the meteorites layer's style object:
filter: ['between', ['get', 'year'], periodStart, ['var', 'currentYear']],
The filter references a periodStart variable, which is an expression on its own that we need to define. While we're at it, we define a few more of those to use in the style object. Let's add the following above the const meteorites layer definition:
const period = 10;
const periodStart = ['-', ['var', 'currentYear'], period];
const decay = [
  'interpolate',
  ['linear'],
  ['get', 'year'],
  periodStart,
  0,
  ['var', 'currentYear'],
  1,
];
The decay is an expression we're going to use to fade out circles by reducing their size and opacity. It gives us a value between 0 and 1, which we can apply as multiplier for the fade effect. To use it for reducing the size over time, we have to modify the circle-radius in the style object:
'circle-radius': [
  '*',
  decay,
  ['+', ['*', ['clamp', ['*', ['get', 'mass'], 1 / 20000], 0, 1], 9], 4],
],
The existing expression is the fourth line of the new circle-radius expression.
For reducing the opacity over time, we also apply the decay to the circle-fill-color:
'circle-fill-color': ['color', 255, 0, 0, ['*', 0.5, decay]],
Previously we had an rgba color, now we use a color expression consisting of r, g, b and alpha values. The alpha value is now dynamic and considers the decay.

Congratulations!